---
title: "The Monster Inside the Equations"
number-sections: true
---
::: {.callout-note icon=false}
## Learning Objectives
- Understand what turbulence is physically and why it is hard
- Follow Reynolds's 1883 pipe experiment
- Understand Kolmogorov's 1941 energy cascade theory
- Understand why CFD is an approximation and what the approximations are
:::
## What Turbulence Looks Like
Light a match and hold it still. For the first inch or two, the hot air above the flame rises smoothly, in orderly layers, the plume a well-behaved column. Then, somewhere above that, it breaks apart. The smooth column dissolves into eddies, and the eddies dissolve into smaller eddies, and the whole structure flickers and writhes with no apparent pattern. You have watched the transition from laminar to turbulent flow.
This transition is not a defect of the flame or a failure of the air. It is the Navier-Stokes equations doing exactly what they do at high Reynolds number. The smooth solution becomes unstable. Small perturbations --- a vibration, a slight asymmetry, the motion of your breath --- grow rather than decay. The flow reorganizes into a state that is not disordered in any absolute sense but that is sensitive to initial conditions in ways that make detailed prediction effectively impossible.
Turbulence is not chaos in the technical mathematical sense, though it shares some properties with chaotic systems. It is a regime of the Navier-Stokes equations that we can simulate but not solve analytically, that we can model but not derive, and whose statistical properties we can partially predict but whose instantaneous details we cannot.
It is the reason that the equations are a Millennium Prize Problem.
## Reynolds's Pipe
Osborne Reynolds was a professor of engineering at Owens College in Manchester, and in 1883 he published one of the most elegant experiments in the history of fluid mechanics. His apparatus was simple: a glass-walled pipe carrying water, with a fine tube at the inlet through which he introduced a thread of dye. At low flow speeds, the dye moved as a straight line through the pipe --- laminar flow, the layers staying separate. As he increased the speed, the dye line began to waver. Above a critical speed, it broke apart and dispersed throughout the cross-section within a few pipe diameters of the inlet. Turbulence.
Reynolds's experiment made three things clear. First, the transition was sharp: there was a critical velocity above which smooth flow became impossible. Second, the critical velocity depended on the pipe diameter, the fluid's viscosity, and the fluid's density in exactly the combination that his analysis predicted --- the ratio we now call the Reynolds number, @eq-reynolds. Third, the transition was not about the fluid; it was about the flow. Water could be made to flow smoothly or turbulently depending only on the geometry and speed, not on any property unique to water.
What Reynolds could not do was explain *why* the smooth solution became unstable. That required a theory of turbulence, and such a theory did not arrive until 1941.
## Kolmogorov's Cascade
Andrei Nikolaevich Kolmogorov was a Soviet mathematician who in 1941 published three papers on the statistical structure of turbulence. The papers were brief, densely argued, and, given their content, remarkably unassuming. They contained what is now called the Kolmogorov theory of turbulence, and they are among the most cited papers in the physical sciences.
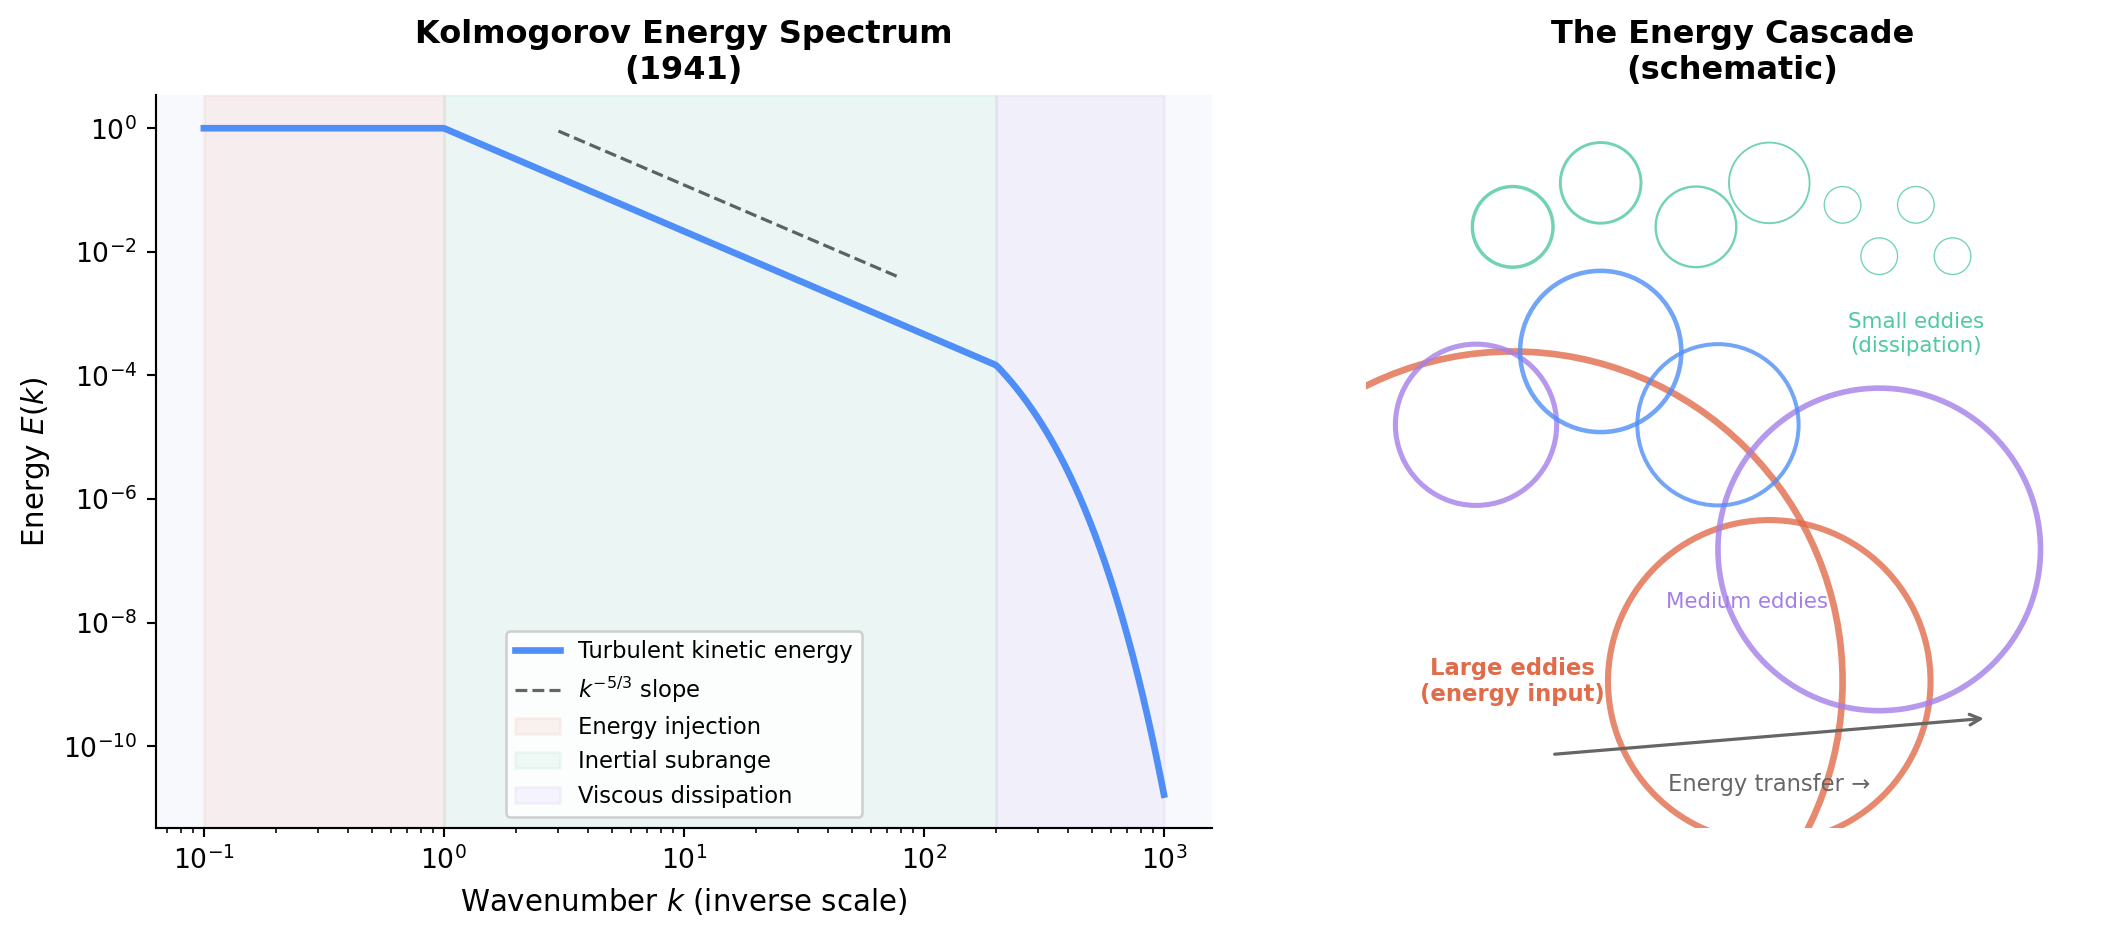
Kolmogorov's central idea was this: in fully developed turbulence, energy enters the flow at large scales (through the boundary conditions, the driving force, the geometry) and is transferred to progressively smaller scales through the interaction of eddies, until it reaches scales small enough that viscosity can convert kinetic energy into heat. This is the *energy cascade*.
He made a further argument: at scales well separated from both the large energy-input scale and the small dissipation scale, the statistics of the turbulence should depend only on the rate of energy transfer through the cascade and the viscosity. This is the *inertial subrange*. In this range, the energy spectrum --- the distribution of kinetic energy as a function of wavenumber $k$ (inverse scale) --- takes the form:
$$E(k) \sim \varepsilon^{2/3} k^{-5/3}$$ {#eq-kolmogorov}
where $\varepsilon$ is the energy dissipation rate per unit mass. This $k^{-5/3}$ scaling --- the Kolmogorov spectrum --- has been confirmed in measurements ranging from wind tunnels to the ocean to the atmosphere to the solar wind. It is one of the best-confirmed scaling laws in physics.
```{python}
import numpy as np
import matplotlib.pyplot as plt

fig, axes = plt.subplots(1, 2, figsize=(12, 5))

# Left: Kolmogorov energy spectrum
k = np.logspace(-1, 3, 400)

k_start = 1.0    # energy injection scale
k_dissip = 200.0 # dissipation scale

# Piecewise: flat injection range, -5/3 inertial subrange, steep dissipation
def energy_spectrum(k, k_start=1.0, k_dissip=200.0):
    E = np.zeros_like(k)
    # Injection range (large scales): roughly flat
    low = k < k_start
    # Inertial subrange
    mid = (k >= k_start) & (k <= k_dissip)
    # Dissipation range
    high = k > k_dissip

    E[low] = 1.0
    E[mid] = (k[mid] / k_start)**(-5/3)
    E[high] = (k_dissip / k_start)**(-5/3) * np.exp(-4 * (k[high] / k_dissip - 1))
    return E

E = energy_spectrum(k)

ax = axes[0]
ax.loglog(k, E, color='#4f8ef7', linewidth=2.5, label='Turbulent kinetic energy')

# Mark -5/3 slope reference
k_ref = np.array([3, 80])
E_ref = 0.9 * (k_ref / 3)**(-5/3)
ax.loglog(k_ref, E_ref, 'k--', linewidth=1.2, alpha=0.6, label='$k^{-5/3}$ slope')

ax.axvspan(k[0], k_start, alpha=0.08, color='#e06c4a', label='Energy injection')
ax.axvspan(k_start, k_dissip, alpha=0.08, color='#4ec9a0', label='Inertial subrange')
ax.axvspan(k_dissip, k[-1], alpha=0.08, color='#a47ee8', label='Viscous dissipation')

ax.set_xlabel('Wavenumber $k$ (inverse scale)', fontsize=11)
ax.set_ylabel('Energy $E(k)$', fontsize=11)
ax.set_title("Kolmogorov Energy Spectrum\n(1941)", fontsize=12, fontweight='bold')
ax.legend(fontsize=8.5, framealpha=0.9)
ax.spines['top'].set_visible(False)
ax.spines['right'].set_visible(False)
ax.set_facecolor('#f8f9fc')

# Right: scale of turbulent eddies — energy cascade schematic
ax2 = axes[1]
ax2.set_xlim(0, 10)
ax2.set_ylim(0, 10)
ax2.set_aspect('equal')
ax2.axis('off')
ax2.set_facecolor('#f8f9fc')
ax2.set_title("The Energy Cascade\n(schematic)", fontsize=12, fontweight='bold')

np.random.seed(7)
# Draw circles of decreasing size to represent eddy cascade
sizes = [(4.5, 2.0, 2.0), (2.2, 5.5, 2.0), (2.2, 7.0, 3.8),
         (1.1, 1.5, 5.5), (1.1, 3.2, 6.5), (1.1, 4.8, 5.5),
         (0.55, 2.0, 8.2), (0.55, 3.2, 8.8), (0.55, 4.5, 8.2), (0.55, 5.5, 8.8),
         (0.25, 6.5, 8.5), (0.25, 7.0, 7.8), (0.25, 7.5, 8.5), (0.25, 8.0, 7.8)]

colors_cascade = ['#e06c4a', '#a47ee8', '#4f8ef7', '#4ec9a0']
for i, (r, cx, cy) in enumerate(sizes):
    c = colors_cascade[min(i // 2, 3)]
    circle = plt.Circle((cx, cy), r, fill=False, color=c,
                         linewidth=max(0.5, 2.5 - i * 0.2), alpha=0.8)
    ax2.add_patch(circle)

ax2.annotate('Large eddies\n(energy input)', xy=(2.0, 2.0), fontsize=8.5,
             ha='center', va='center', color='#e06c4a', fontweight='bold')
ax2.annotate('Medium eddies', xy=(5.2, 3.0), fontsize=8,
             ha='center', color='#a47ee8')
ax2.annotate('Small eddies\n(dissipation)', xy=(7.5, 6.5), fontsize=8,
             ha='center', color='#4ec9a0')
ax2.annotate('', xy=(8.5, 1.5), xytext=(2.5, 1.0),
             arrowprops=dict(arrowstyle='->', color='#666', lw=1.2))
ax2.text(5.5, 0.5, 'Energy transfer →', fontsize=8.5, ha='center', color='#666')

plt.tight_layout()
plt.savefig('docs/turbulence.png', dpi=150, bbox_inches='tight')
plt.show()
```
The Kolmogorov spectrum has a remarkable implication for computation. To simulate turbulence directly --- to resolve all scales from the energy-input scale down to the dissipation scale --- the number of grid points required scales roughly as $Re^{9/4}$. A pipe flow at $Re = 10^6$ (a gentle water main) requires on the order of $10^{13}$ grid points. A jet engine operates at $Re \approx 10^7$, which would require $10^{16}$ grid points. These numbers are not currently achievable. They will not be achievable on any computing hardware that exists or is projected to exist for the foreseeable future.
This is not a temporary engineering limitation waiting for Moore's Law. It is a property of the physics.
## What CFD Actually Does
Computational fluid dynamics --- the numerical solution of the Navier-Stokes equations on a computer --- does not solve this problem. It works around it.
The standard approach is called Reynolds-Averaged Navier-Stokes (RANS). The velocity field is decomposed into a mean component and a fluctuating component: $\mathbf{u} = \bar{\mathbf{u}} + \mathbf{u}'$. The equations are averaged over time. The mean-flow equations look almost identical to the original Navier-Stokes equations, except that they contain an additional term representing the effect of the turbulent fluctuations on the mean flow: the *Reynolds stress tensor*, $-\rho \overline{\mathbf{u}' \mathbf{u}'}$.
This term is not closed. To use RANS, you must model the Reynolds stress tensor as a function of the mean flow --- a relationship that the Navier-Stokes equations themselves do not provide. This modeling assumption is called the turbulence model. Every commercial CFD solver uses one: $k$-$\varepsilon$, $k$-$\omega$, the Spalart-Allmaras model, and many others. Each is a calibrated approximation. Each is wrong in some flow regimes.
This is the state of engineering fluid mechanics: we use the Navier-Stokes equations every day, in every aircraft, every turbine, every combustion chamber, with models we know are approximate and trust because they have been validated against experiment. The equations are correct; the solutions are compromises.
## Summary
Turbulence is the high-Reynolds-number regime of the Navier-Stokes equations, characterized by chaotic multi-scale motion. Reynolds's 1883 pipe experiment demonstrated the transition quantitatively. Kolmogorov's 1941 theory described the statistical structure of turbulence through the energy cascade, predicting the $k^{-5/3}$ spectrum that has been confirmed across many orders of magnitude in scale. Direct numerical simulation of turbulence requires grid counts that scale as $Re^{9/4}$, making full-resolution simulation impossible at engineering Reynolds numbers. CFD uses turbulence models --- calibrated approximations bolted onto averaged equations --- to make the problem tractable. These models work. We do not fully understand why.
## Further Reading
- Richardson, L.F. *Weather Prediction by Numerical Process*. Cambridge, 1922. Contains the original "big whirls have little whirls" verse that presaged the cascade idea.
- Kolmogorov, A.N. "The local structure of turbulence in incompressible viscous fluid for very large Reynolds numbers." *Doklady Akademii Nauk SSSR*, 30 (1941): 301–305. Three pages. Extremely important.
- Pope, S.B. *Turbulent Flows*. Cambridge University Press, 2000. The standard graduate text on turbulence modeling.
- Tennekes, H. & Lumley, J.L. *A First Course in Turbulence*. MIT Press, 1972. Accessible treatment of the cascade and the Kolmogorov scales.