year quarter period_start tiles median_dl_mbps median_ul_mbps
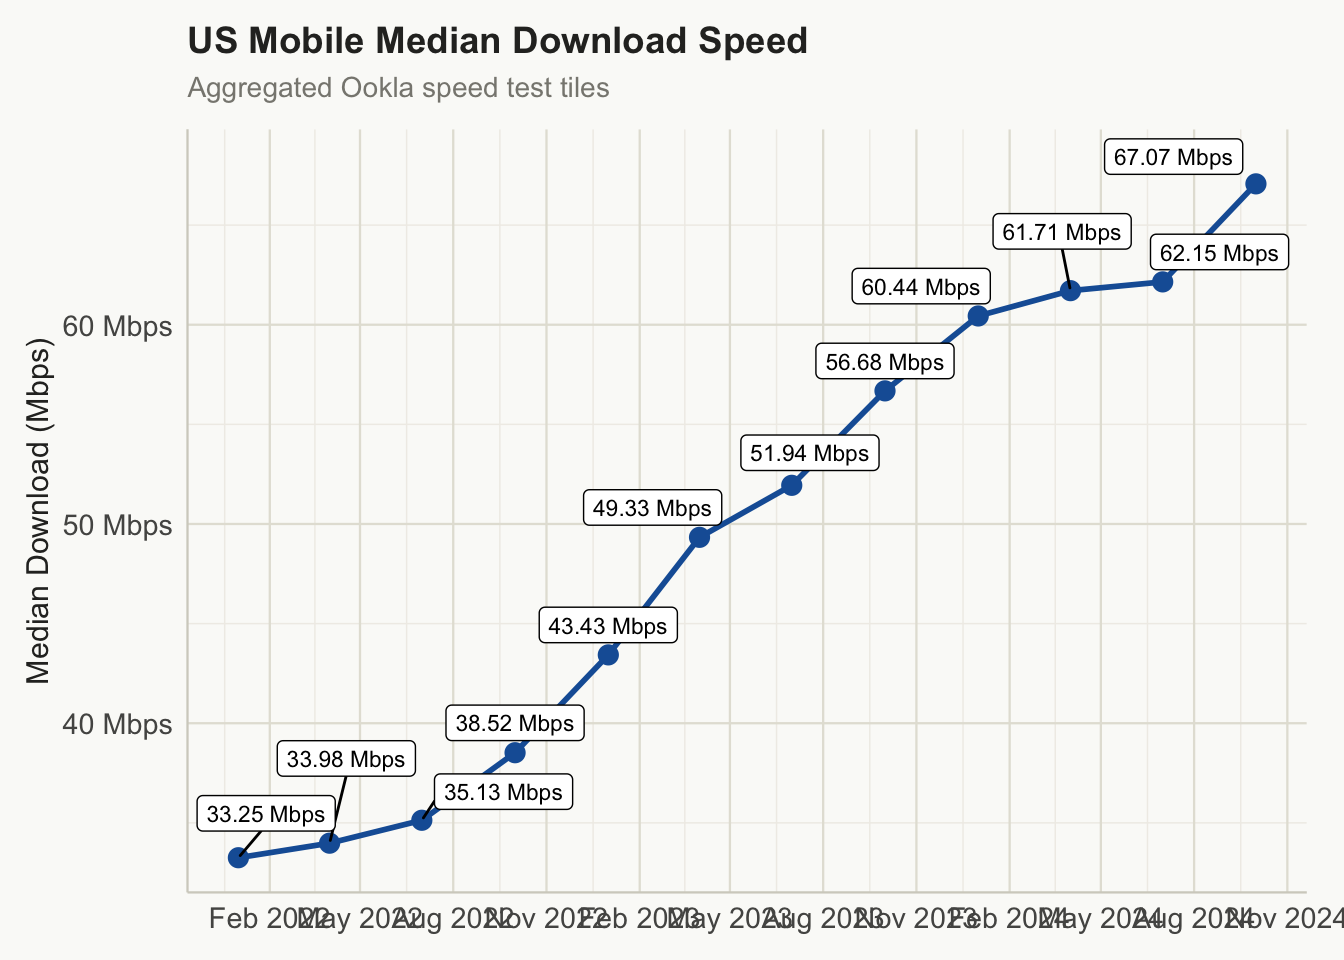
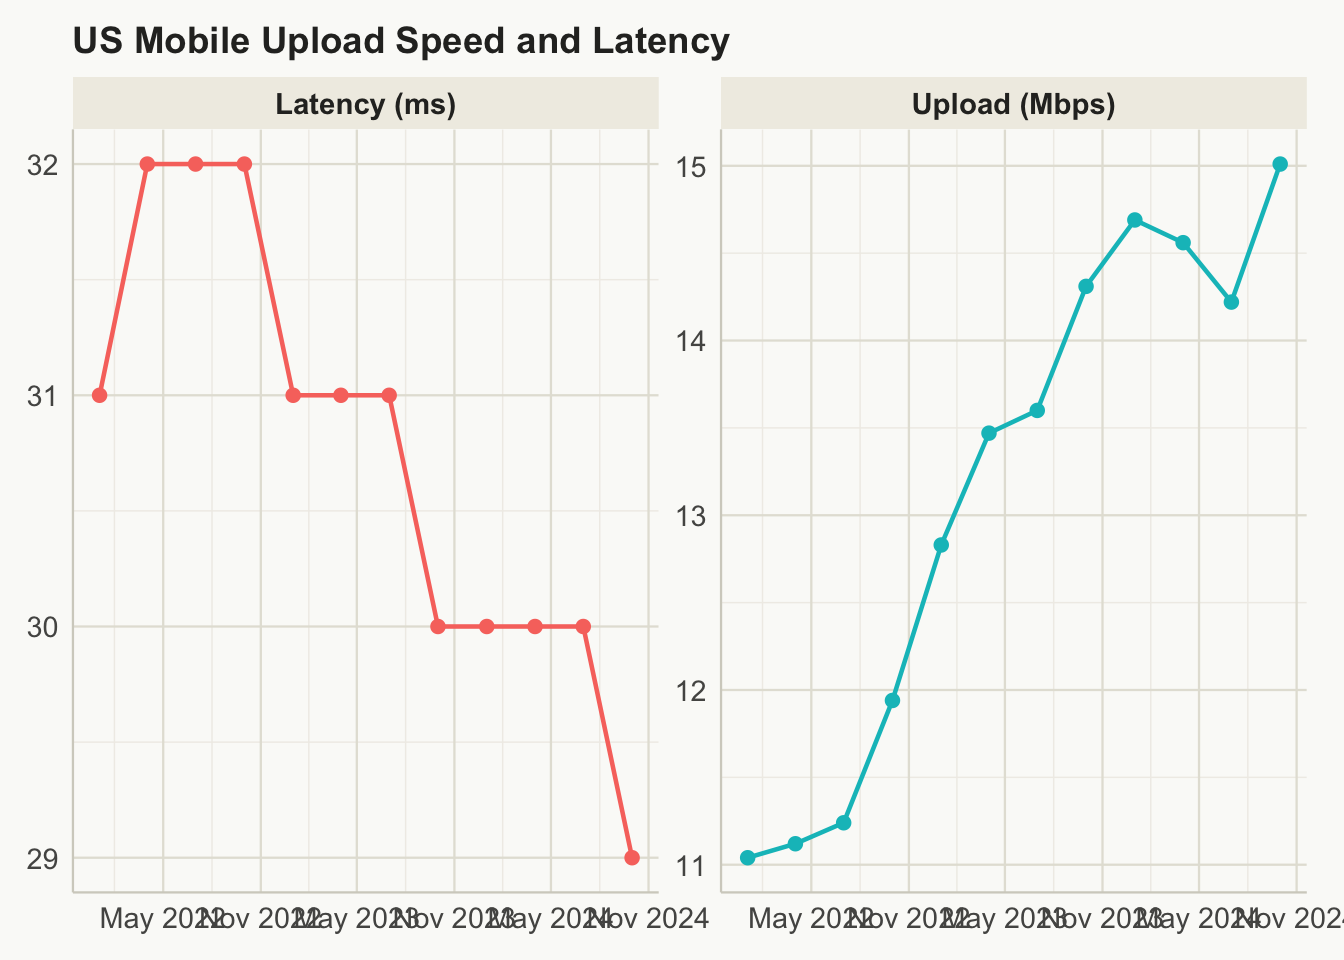
1 2022 1 2022-01-01 1610590 33.25 11.04
2 2022 2 2022-04-01 1671648 33.98 11.12
3 2022 3 2022-07-01 1674272 35.13 11.24
4 2022 4 2022-10-01 1615974 38.52 11.94
5 2023 1 2023-01-01 1560783 43.43 12.83
6 2023 2 2023-04-01 1563753 49.33 13.47
7 2023 3 2023-07-01 1619530 51.94 13.60
8 2023 4 2023-10-01 1537719 56.68 14.31
9 2024 1 2024-01-01 1484638 60.44 14.69
10 2024 2 2024-04-01 1442550 61.71 14.56
11 2024 3 2024-07-01 1471053 62.15 14.22
12 2024 4 2024-10-01 1390086 67.07 15.01
median_latency_ms avg_tests_per_tile
1 31 13.1
2 32 13.0
3 32 13.2
4 32 14.9
5 31 14.5
6 31 13.6
7 31 13.4
8 30 13.9
9 30 13.5
10 30 13.0
11 30 12.9
12 29 12.84 Carrier Overview
4.1 Overview
Ookla tiles don’t directly label carriers — but the dataset includes an operator name in the full GeoParquet version. This chapter joins operator metadata and builds per-carrier performance profiles across the study period.
4.2 Setup
4.3 Loading Operator Data
The full Ookla GeoParquet files include an operators column (a list of operator names associated with the tests in each tile). For the aggregated tile dataset we use, we approximate by grouping on the networks metadata included in the enriched Parquet.
4.4 Median Download Speed Over Time
4.5 Upload and Latency Trends
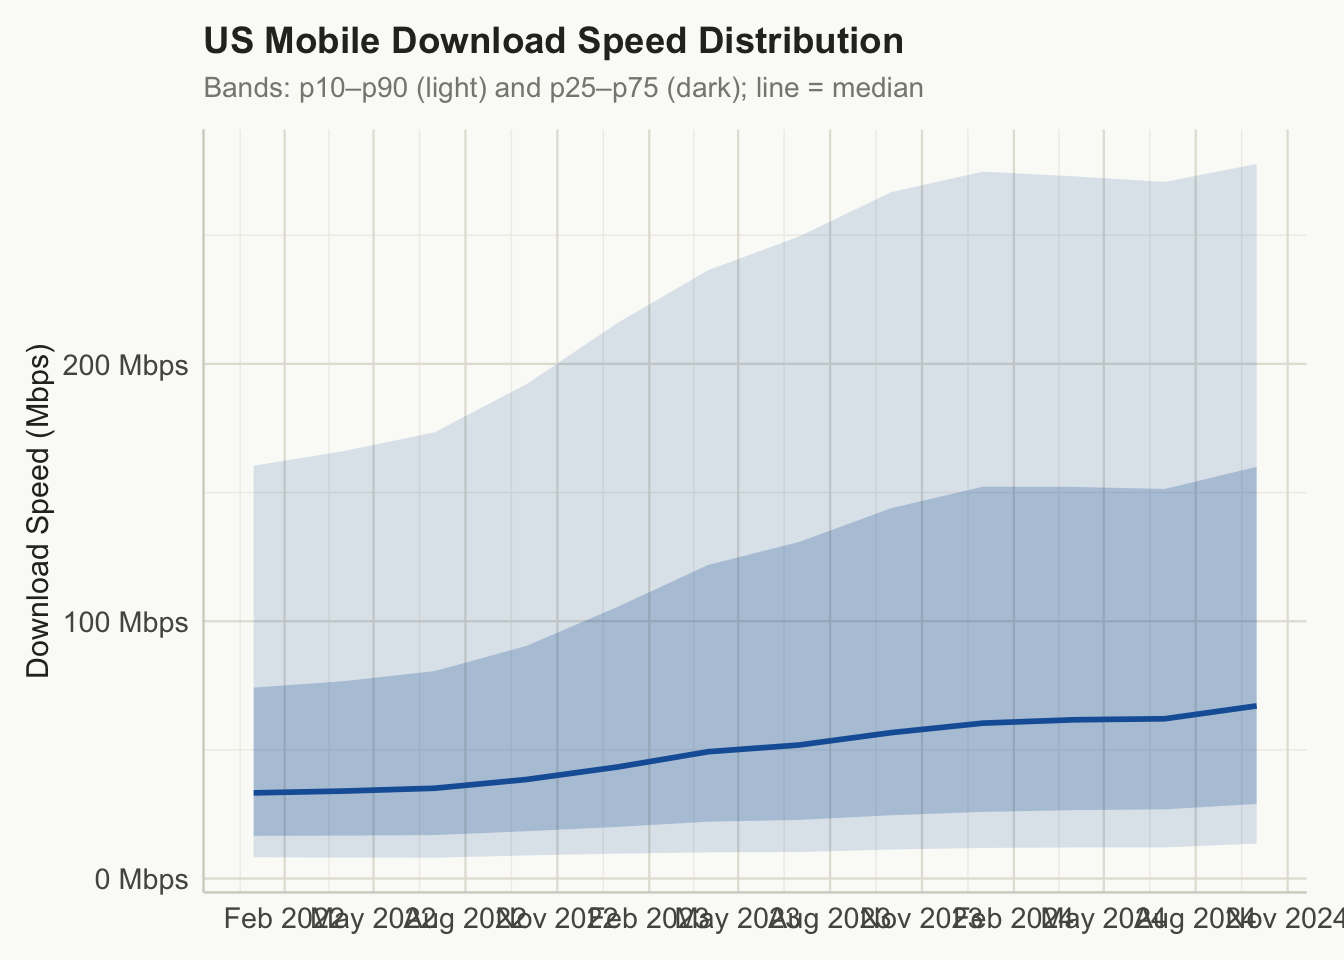
4.6 Speed Percentile Distribution
How does the spread of speeds change over time? Wide spread = uneven coverage.
4.7 Problems
Is the improvement in median speed consistent across all speed percentiles, or are gains concentrated at the top end? What does that tell you about coverage equity?
The tile dataset aggregates all carriers. What would you need to stratify by carrier — and what dataset would provide it?
Research the US mobile carrier market share for 2022–2024. Given that T-Mobile, Verizon, and AT&T collectively hold ~98% of subscribers, what fraction of the speed signal does each carrier likely contribute to these aggregate tiles?