Change points detected at index: 3 4 5 7 8 11 Corresponding dates: 2022-07-01 2022-10-01 2023-01-01 2023-07-01 2023-10-01 2024-07-01 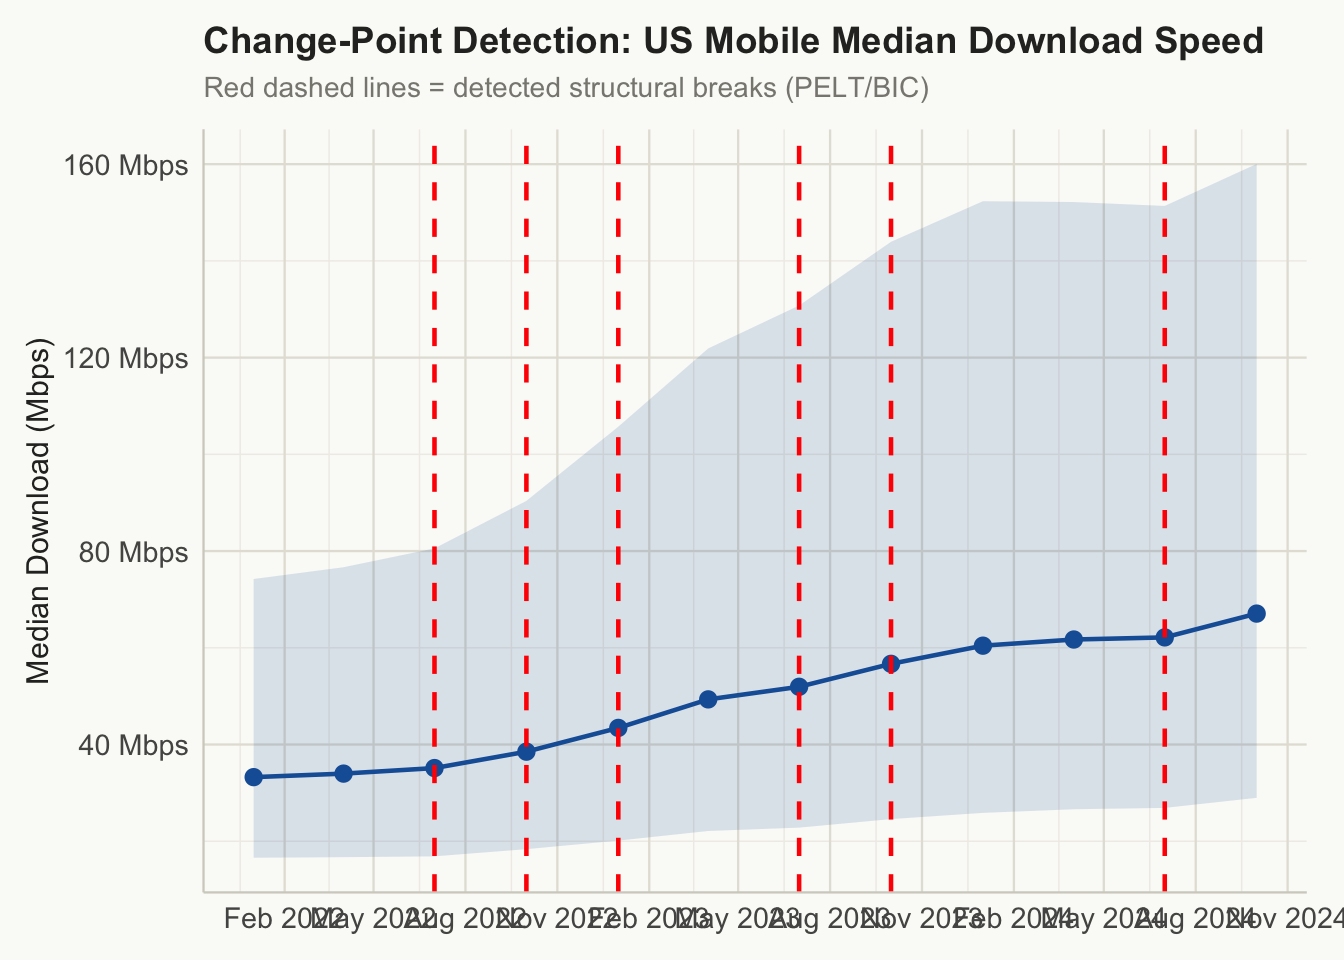
Carriers typically advertise “unlimited” data but state in fine print that speeds may be reduced after a usage threshold (commonly 50–100 GB/month). This chapter introduces the statistical methods for detecting such breakpoints and applies them to throughput time series.
Important caveat: The Ookla tile dataset aggregates all tests in a tile across all users — it cannot directly observe a single user’s data consumption. What we can detect:
True per-user throttle detection requires the Wehe or M-Lab datasets (introduced at the end of this chapter).
changepoint::cpt.mean() tests whether the mean of a time series shifts at any point. A detected change-point suggests a structural shift — which could be a carrier policy change, a spectrum auction result, or network investment.
Change points detected at index: 3 4 5 7 8 11 Corresponding dates: 2022-07-01 2022-10-01 2023-01-01 2023-07-01 2023-10-01 2024-07-01
Speed improvements can mask increasing variance — meaning some users are getting much faster while others stay slow (consistent with throttling behavior).
Variance change points at indices: To understand what throttle detection looks like at the user level, we simulate a throughput time series that crosses a throttle threshold:
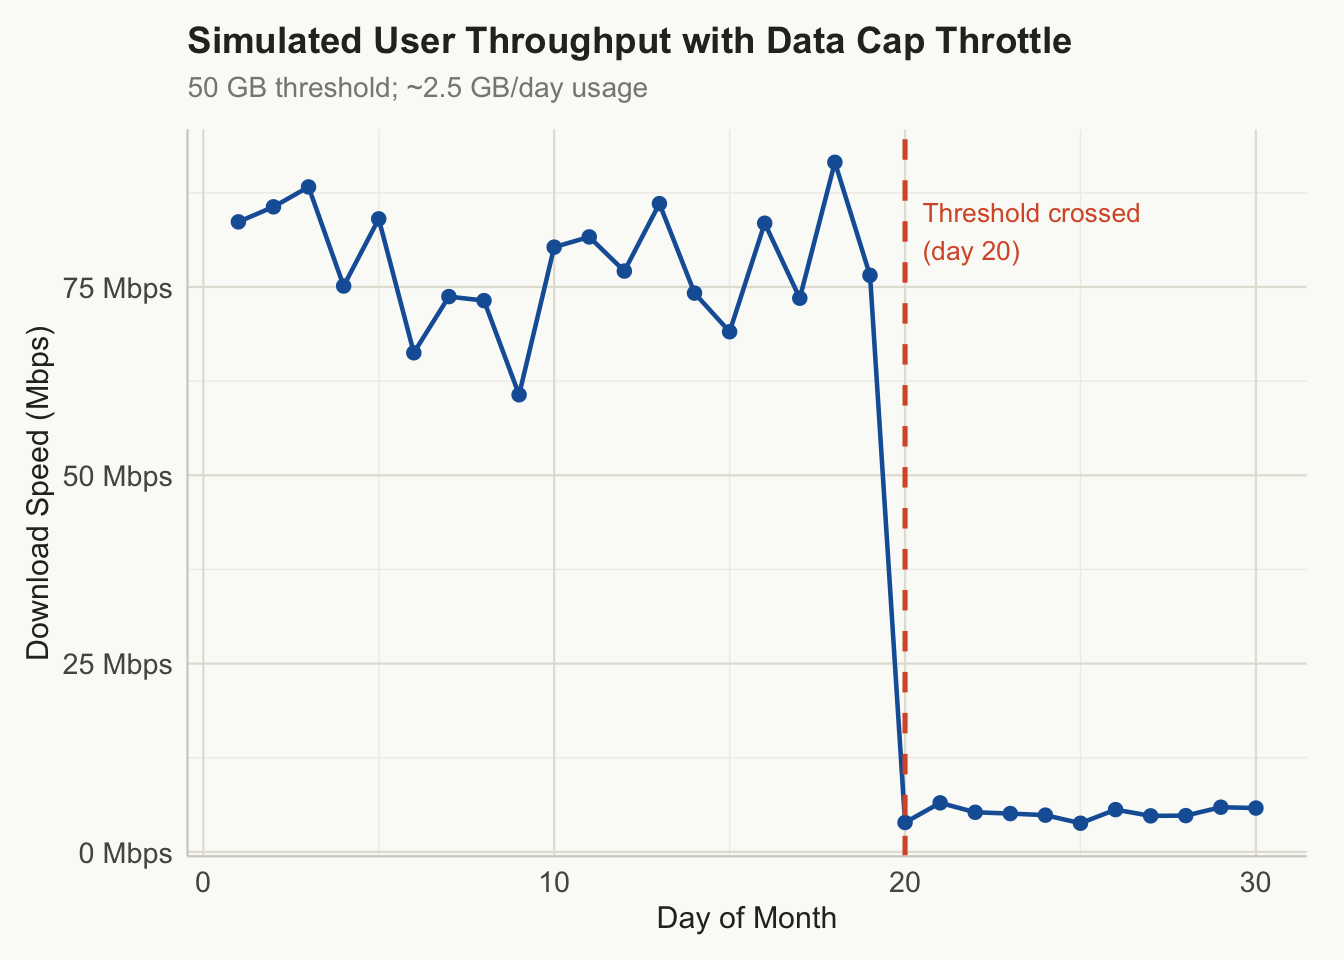
If you know the stated threshold (e.g. 50 GB), RDD is the cleanest estimator of the causal throttle effect — it compares users just below vs. just above the limit:
RDD requires per-user data. See next steps for Wehe/M-Lab integration.The Ookla tile data establishes the market-level baseline. To detect app-specific or user-level throttling:
| Dataset | How to access | What it adds |
|---|---|---|
| Wehe | https://dd.meddle.mobi/wehe.html |
Per-test throttle flag, app-specific, carrier metadata |
| M-Lab NDT | BigQuery measurement-lab.ndt.unified_downloads |
Per-test download speed with ASN (carrier) |
| FCC MBA | data/fcc/ (from fetch_fcc.R) |
Panel tests on fixed devices; known carrier |
# M-Lab via BigQuery (requires Google Cloud free tier)
# library(bigrquery)
# con_bq <- dbConnect(bigquery(),
#                     project = "your-project-id",
# dataset = "measurement-lab.ndt")Apply cpt.meanvar() instead of cpt.mean() — does it detect additional breakpoints? What does a mean+variance change suggest vs. mean-only?
Look up the dates of the T-Mobile/Sprint merger completion and T-Mobile’s 5G mid-band rollout milestones. Do any detected change-points align?
Design a study using the Wehe dataset to test whether YouTube traffic is throttled differently than a generic HTTPS download on the same carrier. What statistical test would you use? What confounders would you need to control for?