   year quarter period_start med_dl qoq_change qoq_pct
1  2022       1   2022-01-01 33.252         NA      NA
2  2022       2   2022-04-01 33.982       0.73     2.2
3  2022       3   2022-07-01 35.129       1.15     3.4
4  2022       4   2022-10-01 38.519       3.39     9.7
5  2023       1   2023-01-01 43.433       4.91    12.8
6  2023       2   2023-04-01 49.330       5.90    13.6
7  2023       3   2023-07-01 51.936       2.61     5.3
8  2023       4   2023-10-01 56.681       4.74     9.1
9  2024       1   2024-01-01 60.437       3.76     6.6
10 2024       2   2024-04-01 61.710       1.27     2.1
11 2024       3   2024-07-01 62.149       0.44     0.7
12 2024 4 2024-10-01 67.069 4.92 7.95 Throughput Trends
5.1 Overview
This chapter models how throughput varies by time, geography, and test volume — building intuition for what “normal” mobile performance looks like before we search for throttling signals in Chapter 5.
5.2 Setup
5.3 Quarter-over-Quarter Change
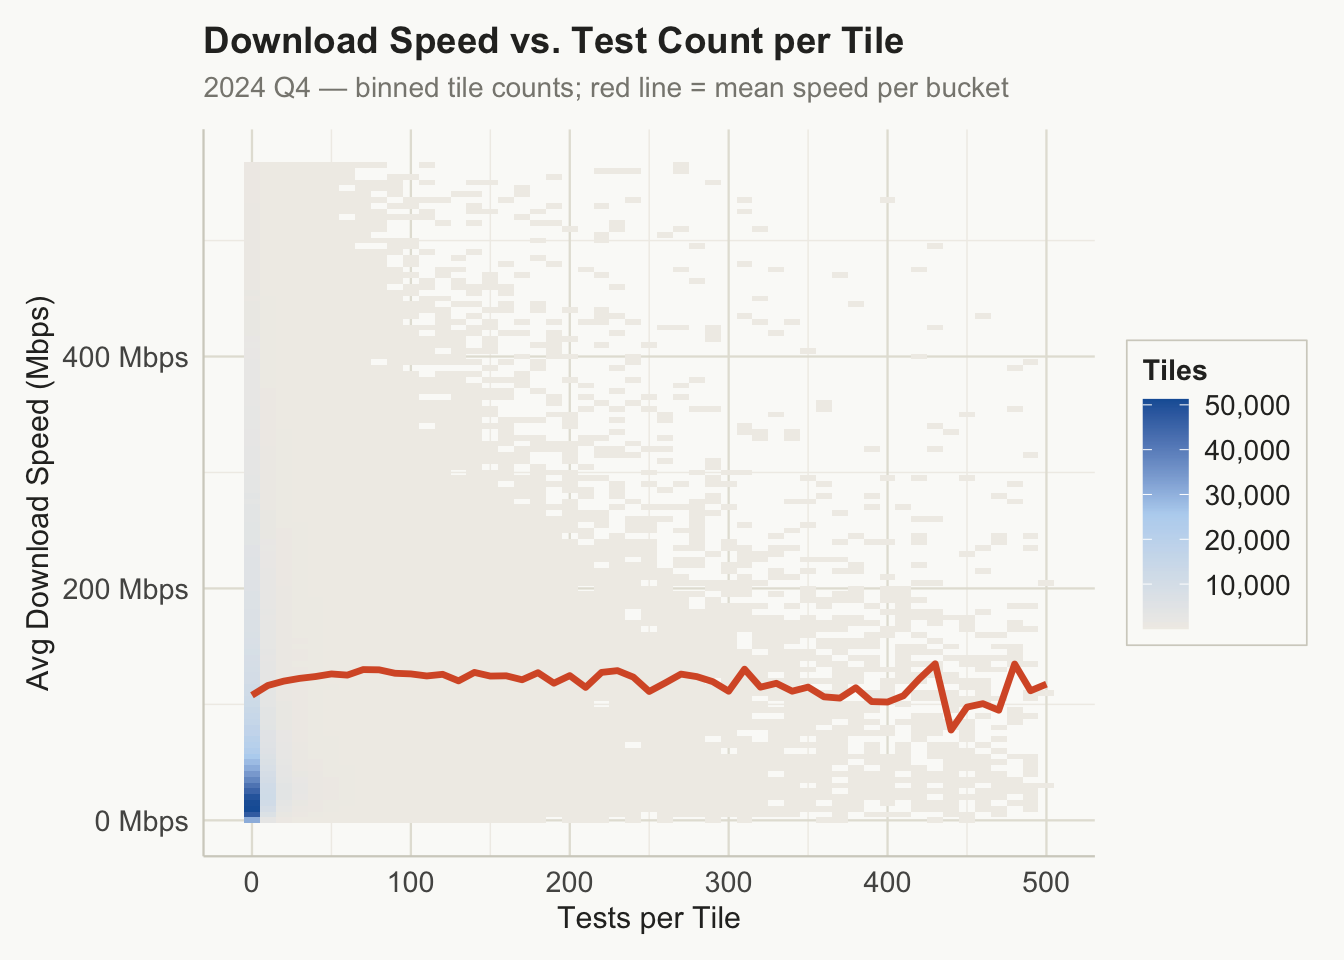
5.4 Speed vs. Test Density
More tests per tile should correlate with denser urban coverage — but are denser tiles faster or slower?
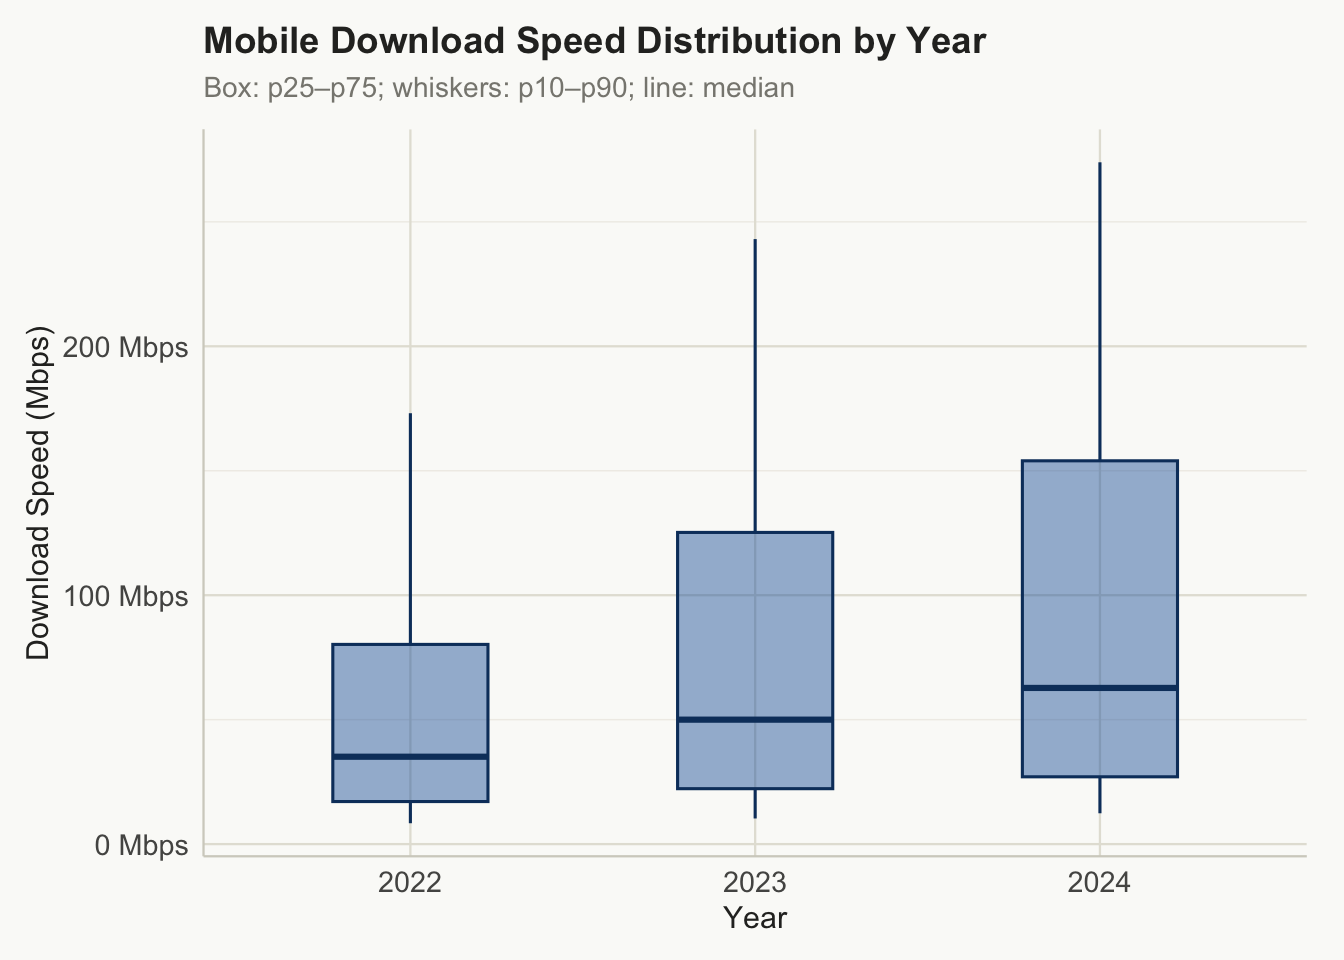
5.5 Speed Distribution by Year
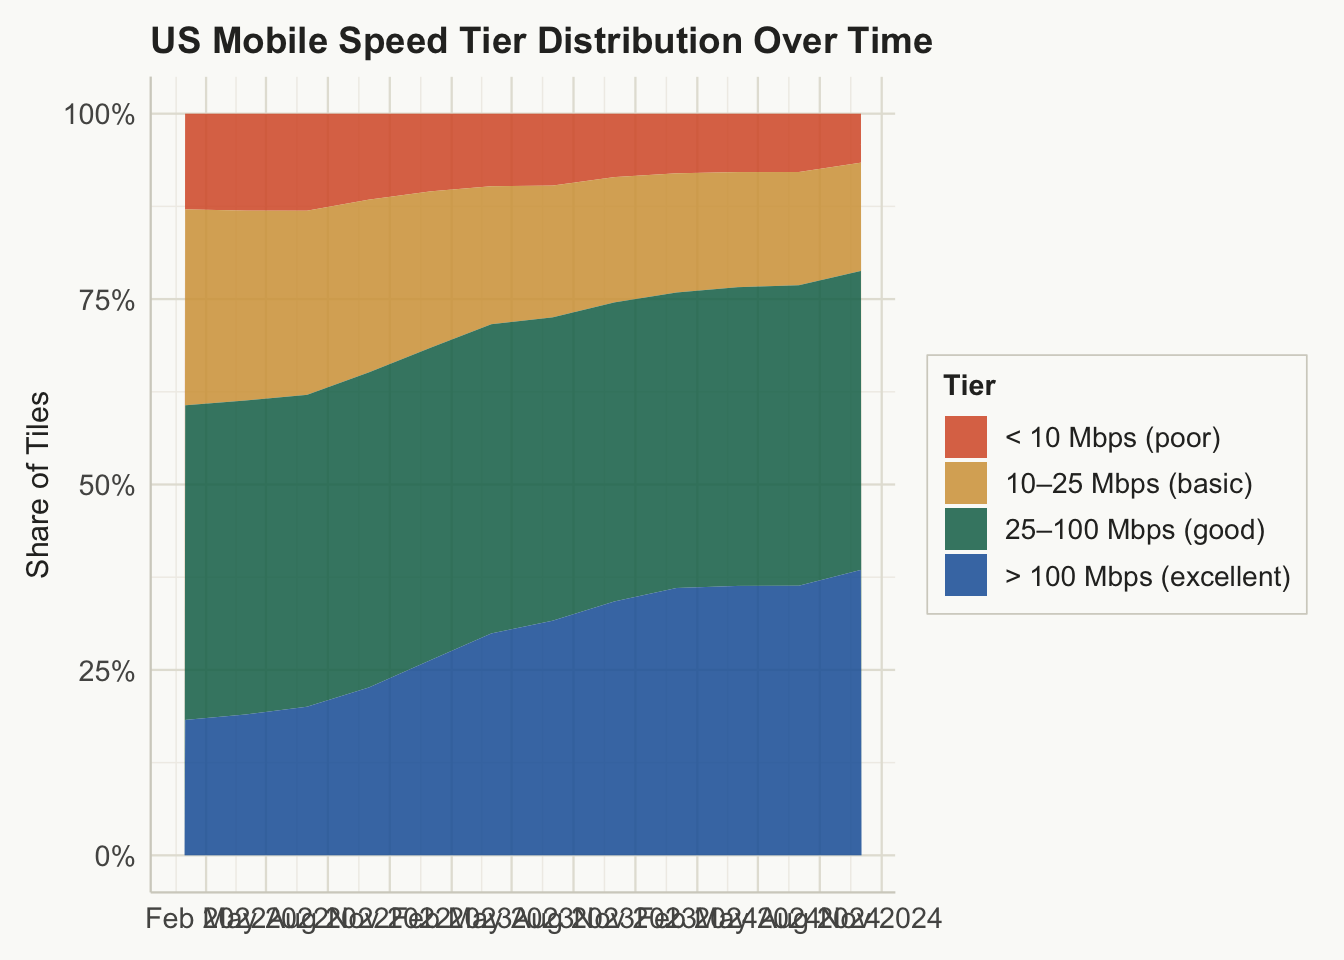
5.6 High vs. Low Speed Tiles
Classify tiles into speed tiers and track their share over time:
5.7 Problems
The FCC defines “broadband” as 25 Mbps down / 3 Mbps up (recently proposed to raise to 100/20). What share of tiles meet each threshold in each quarter?
Fit a simple linear regression of
avg_d_mbps ~ period_start. What is the estimated quarterly improvement in Mbps? Is this statistically significant?Compute the ratio
avg_d_mbps / avg_u_mbps(download-to-upload ratio) per tile. How does this ratio vary by speed tier? What does an unusually high ratio suggest about the network?